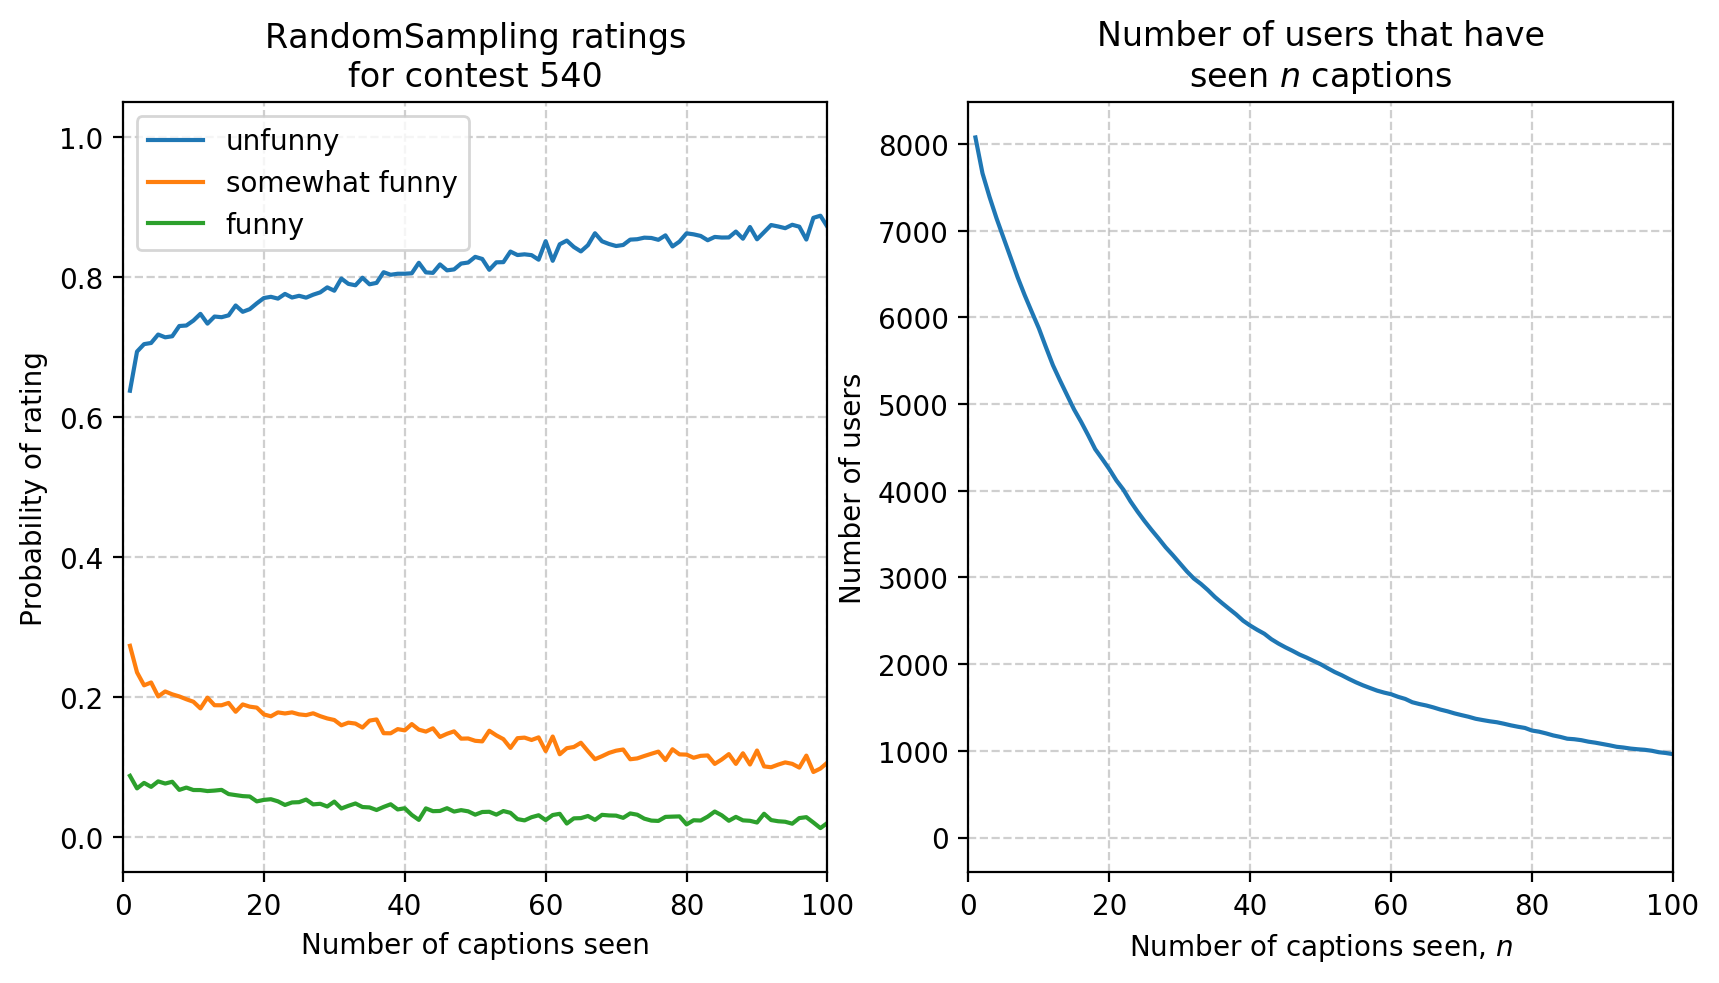
How do ratings behave after users have seen many captions?
This notebook looks at the “vote decay” of users. The New Yorker caption contest organizer, Bob Mankoff, has received many emails like the one below (name/personal details left out for anonymity)
Here’s my issue.
First time I encounter something, I might say it’s funny.
Then it comes back in many forms over and over and it’s no longer funny and I wish I could go back to the first one and say it’s not funny.
But it’s funny, and then I can’t decide whether to credit everyone with funny or keep hitting unfunny. What I really like to find out is who submitted it first, but often it’s slightly different and there may be a best version. Auggh!
How should we do this???
We can investigate this: we have all the data at hand. We record the timestamp, participant ID and their rating for a given caption. So let’s see how votes go after a user has seen \(n\) captions!
[1]:
%matplotlib inline
import pandas as pd
import numpy as np
import matplotlib.pyplot as plt
plt.style.use('seaborn')
[2]:
import caption_contest_data as ccd
Reading in data
Let’s read in the data. As the last column can contain a non-escaped comma, we have to fix that before doing any analysis.
Note that two versions of this notebook exist (the previous notebook can be found in 43bc5d). This highlights some of the differences required to read in the earlier datasets.
[3]:
contest = 540

responses = ccd.responses(contest)

print(len(responses))
responses.head()
452547
[3]:
| alg_label | network_delay | participant_uid | response_time | target | target_id | target_reward | timestamp_query_generated | label | contest | filename | |
|---|---|---|---|---|---|---|---|---|---|---|---|
| 0 | RandomSampling | 0.094617 | d43d742e06d25413ea83b2572248c2_hn5JVUAQmZ6YOgB... | 5.051 | Don't worry. You are safe with me. | 360 | 1 | 2016-10-11 18:06:45.916540 | unfunny | 540 | 540-responses.csv |
| 1 | RandomSampling | 0.099862 | d43d742e06d25413ea83b2572248c2_hn5JVUAQmZ6YOgB... | 5.884 | I promise, all pre-existing conditions will no... | 2104 | 1 | 2016-10-11 18:06:51.124120 | unfunny | 540 | 540-responses.csv |
| 2 | RandomSampling | 0.089427 | d43d742e06d25413ea83b2572248c2_hn5JVUAQmZ6YOgB... | 2.103 | You and me make a great combination Doc! | 4206 | 1 | 2016-10-11 18:06:57.181677 | unfunny | 540 | 540-responses.csv |
| 3 | RandomSampling | 0.087867 | d43d742e06d25413ea83b2572248c2_hn5JVUAQmZ6YOgB... | 4.746 | Zika? No, you're safe. | 412 | 1 | 2016-10-11 18:06:59.441917 | unfunny | 540 | 540-responses.csv |
| 4 | RandomSampling | 0.089464 | d43d742e06d25413ea83b2572248c2_hn5JVUAQmZ6YOgB... | 15.780 | Click ... to the right; click... to the left. ... | 4415 | 1 | 2016-10-11 18:07:04.330232 | unfunny | 540 | 540-responses.csv |
Seeing how many captions a user has seen
This is the workhorse of the notebook: it sees how many captions one participant has seen. I sorted by timestamp (and with an actual timestamp, not a str) to collect the ratings in the order a user has seen. I do not assume that only one user answers at a time.
[4]:
last_id = None
i = 0
num_responses = []
captions_seen = []
responses = responses.sort_values(by='timestamp_query_generated')
# responses = responses[0:1000]  # debug
[5]:
captions_seen_by = {}
captions_seen = []
for _, response in responses.iterrows():
    id_, rating = response['participant_uid'], response['target_reward']
    if id_ not in captions_seen_by:
        captions_seen_by[id_] = 0
    captions_seen_by[id_] += 1
    captions_seen += [captions_seen_by[id_]]
    num_responses += [i]
[6]:
responses['number of captions seen'] = captions_seen
responses.head()
[6]:
| alg_label | network_delay | participant_uid | response_time | target | target_id | target_reward | timestamp_query_generated | label | contest | filename | number of captions seen | |
|---|---|---|---|---|---|---|---|---|---|---|---|---|
| 252687 | RandomSampling | 0.071828 | d43d742e06d25413ea83b2572248c2_EKjDKfTX9LNM2MT... | 4.557 | You probably wouldn't even be here if you had ... | 1490 | 1 | 2016-10-10 17:21:45.573372 | unfunny | 540 | 540-responses.csv | 1 |
| 252688 | RandomSampling | 0.076773 | d43d742e06d25413ea83b2572248c2_EKjDKfTX9LNM2MT... | 14.824 | I guess I don't need to apologize for my cold ... | 2883 | 1 | 2016-10-10 17:21:50.381564 | unfunny | 540 | 540-responses.csv | 2 |
| 252689 | RandomSampling | 0.142236 | d43d742e06d25413ea83b2572248c2_EKjDKfTX9LNM2MT... | 4.752 | I'm sorry but your tumblers are dry, your pett... | 3923 | 1 | 2016-10-10 17:22:05.504520 | unfunny | 540 | 540-responses.csv | 3 |
| 252690 | RandomSampling | 0.070380 | d43d742e06d25413ea83b2572248c2_EKjDKfTX9LNM2MT... | 3.380 | New and improved provider reimbursement under ... | 271 | 1 | 2016-10-10 17:22:10.584019 | unfunny | 540 | 540-responses.csv | 4 |
| 252691 | RandomSampling | 0.068067 | d43d742e06d25413ea83b2572248c2_EKjDKfTX9LNM2MT... | 2.258 | Try a more balanced diet . . . your acid test ... | 3686 | 1 | 2016-10-10 17:22:14.221277 | unfunny | 540 | 540-responses.csv | 5 |
Viewing the data
Now let’s format the data to view it. We can view the data in two ways: as we only have three rating values, we can view the probability of a person rating 1, 2 or 3, and can also view the mean.
In this, we rely on pd.pivot_table. This can take DataFrame that looks like a list of dictionaries and compute aggfunc (by default np.mean) for all items that contain common keys (indicated by index and columns). It’s similar to Excel’s pivot table functionality.
Probability of rating {1, 2, 3}
[7]:
def prob(x):
    n = len(x)
    ret = {'n': n}
    ret.update({name: np.sum(x == i) for name, i in [('unfunny', 1),
                                                  ('somewhat funny', 2),
                                                  ('funny', 3)]})
    return ret

probs = responses.pivot_table(index='number of captions seen',
                              columns='alg_label', values='target_reward',
                              aggfunc=prob)
probs.head()
[7]:
| alg_label | RandomSampling |
|---|---|
| number of captions seen | |
| 1 | {'n': 8076, 'unfunny': 5154, 'somewhat funny':... |
| 2 | {'n': 7663, 'unfunny': 5319, 'somewhat funny':... |
| 3 | {'n': 7390, 'unfunny': 5208, 'somewhat funny':... |
| 4 | {'n': 7142, 'unfunny': 5045, 'somewhat funny':... |
| 5 | {'n': 6915, 'unfunny': 4968, 'somewhat funny':... |
[8]:
d = {label: dict(probs[label]) for label in ['RandomSampling']}
for label in d.keys():
    for n in d[label].keys():
        if d[label][n] is None:
            continue
        for rating in ['unfunny', 'somewhat funny', 'funny']:
            d[label][n][rating] = d[label][n][rating] / d[label][n]['n']
[9]:
df = pd.DataFrame(d['RandomSampling']).T
df = pd.concat({'RandomSampling': df}, axis=1)
df.head()
[9]:
| RandomSampling | ||||
|---|---|---|---|---|
| n | unfunny | somewhat funny | funny | |
| 1 | 8076.0 | 0.638187 | 0.273774 | 0.088039 |
| 2 | 7663.0 | 0.694115 | 0.235808 | 0.070077 |
| 3 | 7390.0 | 0.704736 | 0.217321 | 0.077943 |
| 4 | 7142.0 | 0.706385 | 0.221367 | 0.072249 |
| 5 | 6915.0 | 0.718438 | 0.201446 | 0.080116 |
[10]:
plt.style.use("default")

fig, axs = plt.subplots(figsize=(8, 4), ncols=2)

alg = "RandomSampling"
show = df[alg].copy()
show["captions seen"] = show.index

for y in ["funny", "somewhat funny", "unfunny"]:
    show.plot(x="captions seen", y=y, ax=axs[0])
show.plot(x="captions seen", y="n", ax=axs[1])

for ax in axs:
    ax.set_xlim(0, 100)
    ax.grid(linestyle='--', alpha=0.5)
[10]:
(0, 100)
[10]:
(0, 100)

[11]:
plt.style.use("default")

def plot(alg):
    fig = plt.figure(figsize=(10, 5))
    ax = plt.subplot(1, 2, 1)
    df[alg][['unfunny', 'somewhat funny', 'funny']].plot(ax=ax)
    plt.xlim(0, 100)
    plt.title('{} ratings\nfor contest {}'.format(alg, contest))
    plt.ylabel('Probability of rating')
    plt.xlabel('Number of captions seen')
    plt.grid(linestyle="--", alpha=0.6)

    ax = plt.subplot(1, 2, 2)
    df[alg]['n'].plot(ax=ax, logy=False)
    plt.ylabel('Number of users')
    plt.xlabel('Number of captions seen, $n$')
    plt.title('Number of users that have\nseen $n$ captions')
    plt.xlim(0, 100)
    plt.grid(linestyle="--", alpha=0.6)

for alg in ['RandomSampling']:
    fig = plot(alg)
    plt.show()
[ ]: