Ratings for top captions
[1]:
import pandas as pd
import matplotlib.pyplot as plt
plt.style.use('ggplot')
[4]:
import caption_contest_data as ccd
[9]:
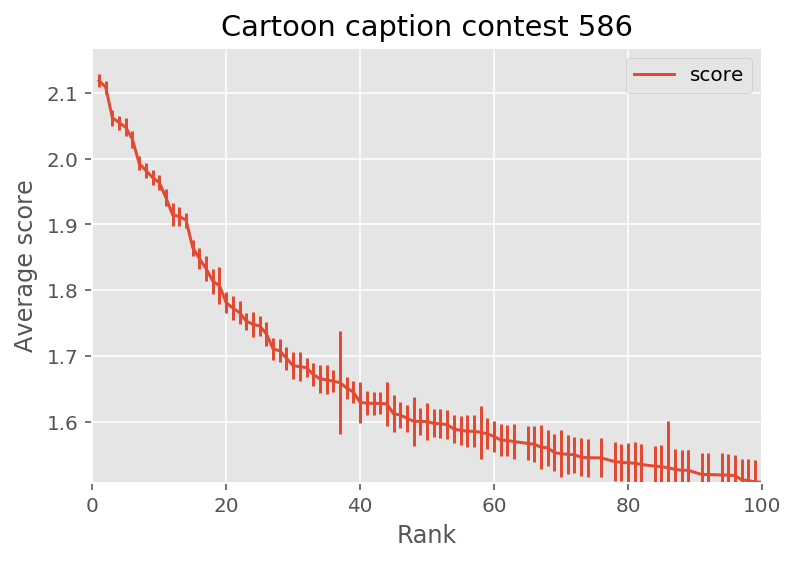
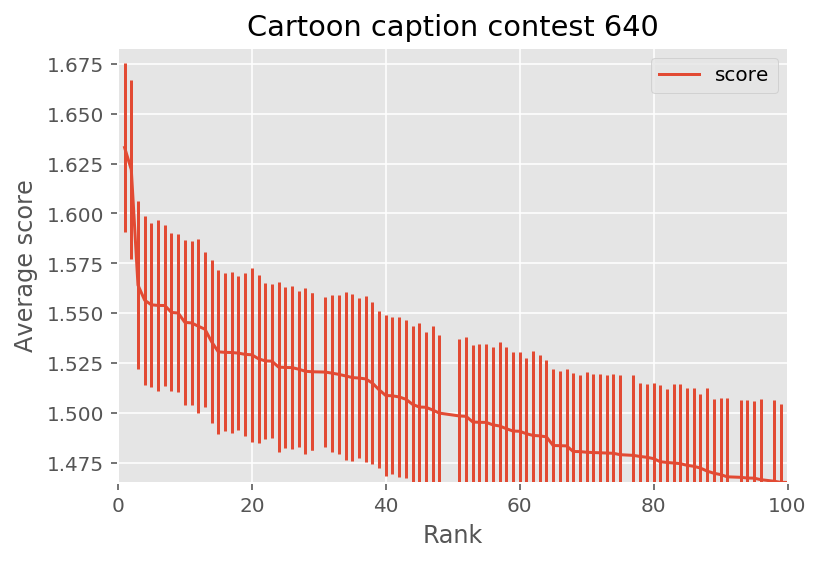
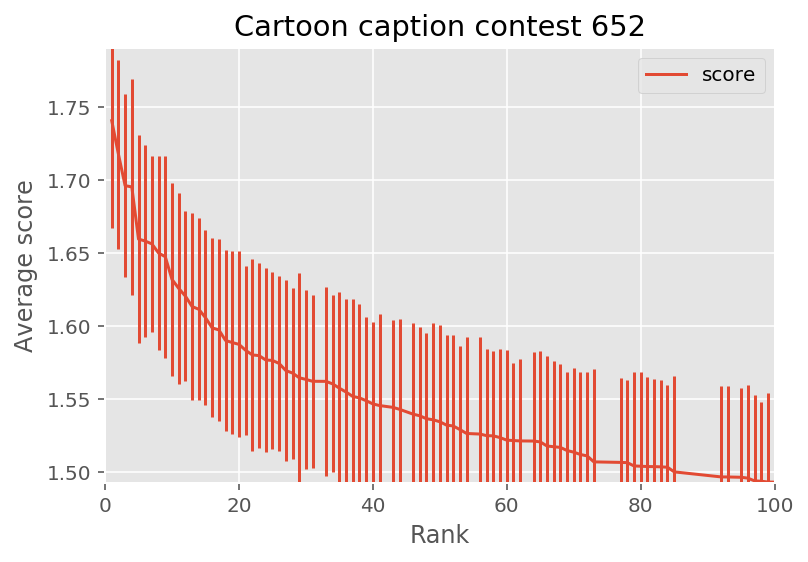
def get_score_plot(contest, N=100):
    df = ccd.summary(contest)
    scores = df.score
    fig, ax = plt.subplots()
    df.plot(x='rank', y='score', yerr='precision', style='_', ax=ax)
    ax.set_xlim(0, N)
    ax.set_ylim(scores[N], scores[0] + 0.05)
    ax.set_title(f'Cartoon caption contest {contest}')
    ax.set_ylabel('Average score')
    ax.set_xlabel('Rank')
    return fig
[10]:
import matplotlib.pyplot as plt
import numpy as np

fig = get_score_plot(586)
[11]:
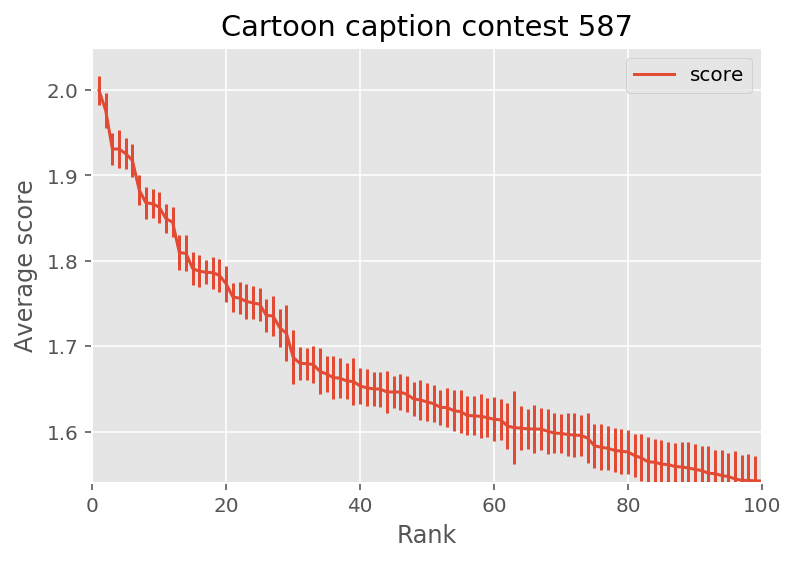
fig = get_score_plot(587)
[12]:
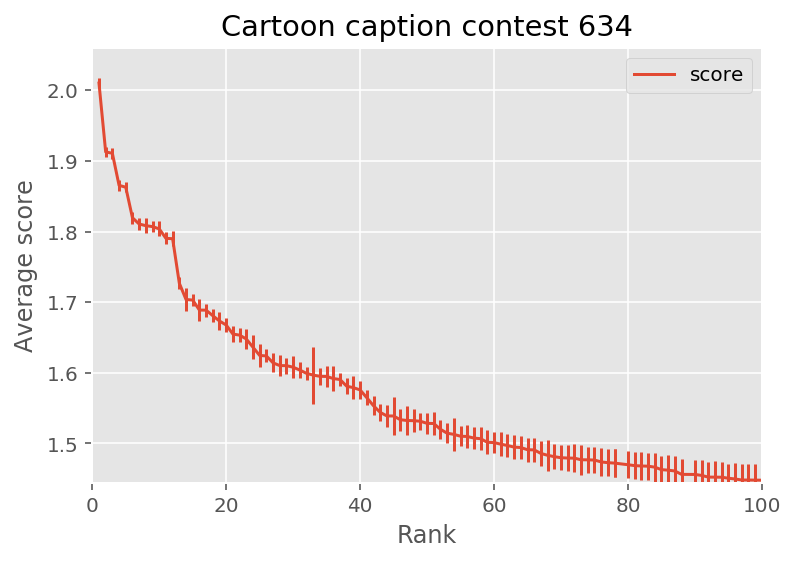
fig = get_score_plot(634)
[13]:
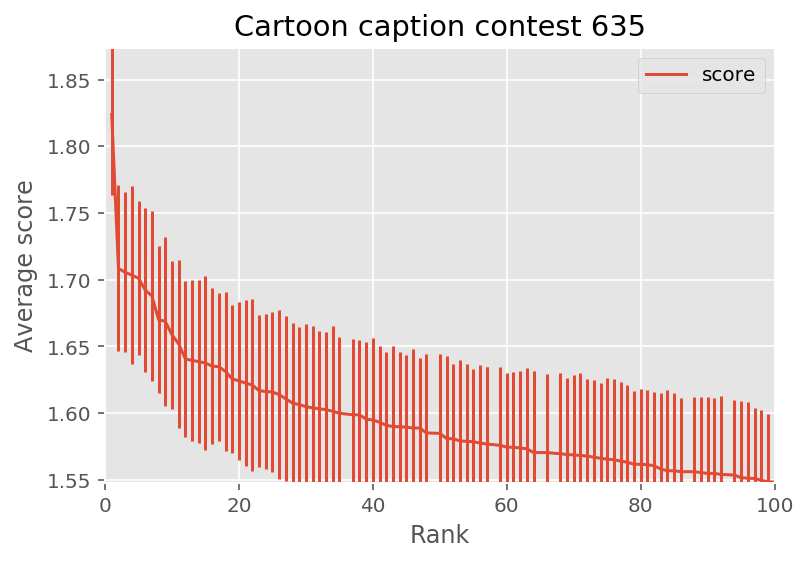
fig = get_score_plot(635)
[14]:
fig = get_score_plot(640)
[15]:
fig = get_score_plot(652)
[ ]: