How many responses per contest?
This notebook will analyze the number of responses/captions per contest, both treating all contest equally and throughout time.
[1]:
import os
import sys
from pathlib import Path
p = Path(".").absolute()
root = p.parent.parent
sys.path.append(str(root))
[2]:
import caption_contest_data as ccd
[3]:
contests = ccd.summary_ids()
print(contests)
{'509-round1_summary_LilUCB.csv', 520, 521, 522, 523, 524, '559_summary_KLUCB.csv', 526, 527, 528, 529, 530, '511_summary_LilUCB.csv', '517_summary_LilUCB.csv', 531, 532, 533, 534, 535, 536, 537, 538, 539, 540, 541, 542, 543, 544, 545, 546, 547, 548, 549, 550, 552, 553, 554, 555, 557, 558, 551, 556, 561, 562, 563, 564, 565, 566, 567, 568, 569, 570, 571, 572, 573, 574, 575, 576, 577, 578, 579, 580, '514_summary_RoundRobin.csv', 581, 582, 583, 584, 585, 586, 587, 588, 589, 590, 591, 592, 593, 594, 595, 596, 597, 598, 599, 600, 601, 602, 603, 604, 605, 606, 607, 608, 609, 610, 611, 612, 613, 614, 615, 616, 617, 618, 619, 620, 621, 622, 623, 624, 625, 626, 627, 628, 629, 630, 631, 632, 633, '512_summary_RoundRobin.csv', 634, 635, 636, '513_summary_RoundRobin.csv', 637, 638, 639, 640, 641, 642, 643, 644, 645, 646, 647, 648, 649, 650, 651, 652, 653, 654, 655, 656, 657, 658, 659, 660, 661, 662, 663, '508-round1_summary_RoundRobin.csv', 665, 666, 667, 668, '508-round1_summary_LilUCB.csv', '515_summary_RoundRobin.csv', 669, 670, 671, 672, 673, 674, 675, 676, 677, 678, 679, 680, 681, 682, 683, 684, 685, '517_summary_RoundRobin.csv', '513_summary_LilUCB.csv', '559_summary_LilUCB.csv', '560_summary_KLUCB_funny.csv', '508-round2_summary_RoundRobin.csv', '514_summary_LilUCB.csv', '509-round2_summary_RoundRobin.csv', '515_summary_LilUCB.csv', '510_summary_LilUCB.csv', '516_summary_LilUCB.csv', '511_summary_RoundRobin.csv', '510_summary_RoundRobin.csv', '512_summary_LilUCB.csv', '518_summary_LilUCB.csv', '560_summary_KLUCB_original.csv', '519_summary_RoundRobin.csv', '559_summary_RandomSamping.csv', '519_summary_LilUCB.csv', '509-round1_summary_RoundRobin.csv', '518_summary_RoundRobin.csv', '516_summary_RoundRobin.csv'}
[4]:
len(contests)
[4]:
193
[5]:
summaries = [ccd.summary(c) for c in contests]
[6]:
import pandas as pd
summary = pd.concat(summaries, sort=False)
[7]:
summary.head()
[7]:
| target_id | rank | funny | somewhat_funny | unfunny | count | score | precision | contest | caption | |
|---|---|---|---|---|---|---|---|---|---|---|
| 0 | 6785.0 | 1 | 22 | 18 | 12 | 52 | 2.192308 | 0.109979 | 509 | I recommend the trout. |
| 1 | 3197.0 | 2 | 5 | 11 | 7 | 23 | 1.913043 | 0.152878 | 509 | May I recommend the trout? |
| 2 | 469.0 | 3 | 5 | 9 | 8 | 22 | 1.863636 | 0.165085 | 509 | On second thought, maybe we should just go wit... |
| 3 | 1800.0 | 4 | 5 | 6 | 8 | 19 | 1.842105 | 0.191381 | 509 | Take my wife, please! |
| 4 | 2317.0 | 5 | 5 | 5 | 9 | 19 | 1.789474 | 0.196146 | 509 | All that work to die a virgin. |
[8]:
import numpy as np
counts = summary.pivot_table(index="contest", values="count", aggfunc=np.sum)
nunique = summary.pivot_table(index="contest", values="caption", aggfunc=lambda x: x.nunique())
df = pd.merge(counts, nunique, left_index=True, right_index=True)
df["n_unique"] = df["caption"]
df.drop(columns="caption", inplace=True)
df.head()
[8]:
| count | n_unique | |
|---|---|---|
| contest | ||
| 508 | 137868 | 6778 |
| 509 | 98241 | 7858 |
| 510 | 82627 | 3905 |
| 511 | 56660 | 3325 |
| 512 | 43120 | 4399 |
[9]:
df.index.unique()
[9]:
Int64Index([508, 509, 510, 511, 512, 513, 514, 515, 516, 517,
            ...
            676, 677, 678, 679, 680, 681, 682, 683, 684, 685],
           dtype='int64', name='contest', length=176)
[10]:
"{} million human responses".format(df["count"].sum() / 1e6)
[10]:
'119.157775 million human responses'
[11]:
"{} captions".format(df["n_unique"].sum())
[11]:
'970327 captions'
[12]:
"{} contests".format(len(df))
[12]:
'176 contests'
[13]:
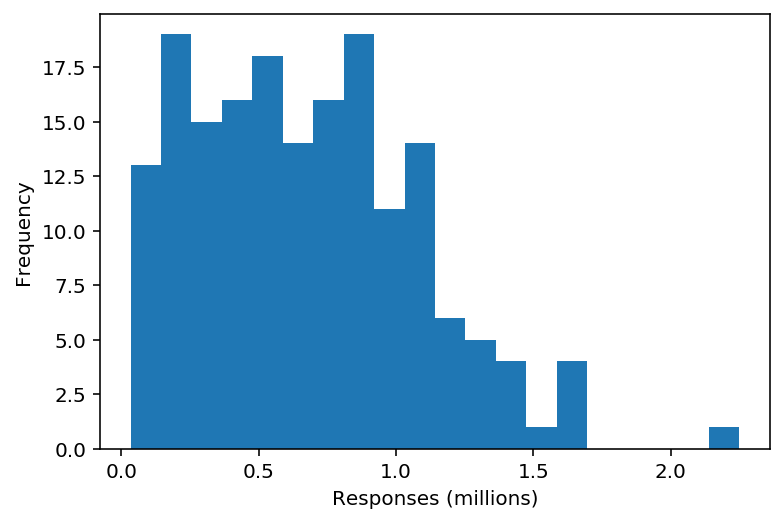
responses = df["count"] / 1e6
ax = responses.plot.hist(bins=20)
ax.set_xlabel("Responses (millions)")
[13]:
Text(0.5, 0, 'Responses (millions)')
[14]:
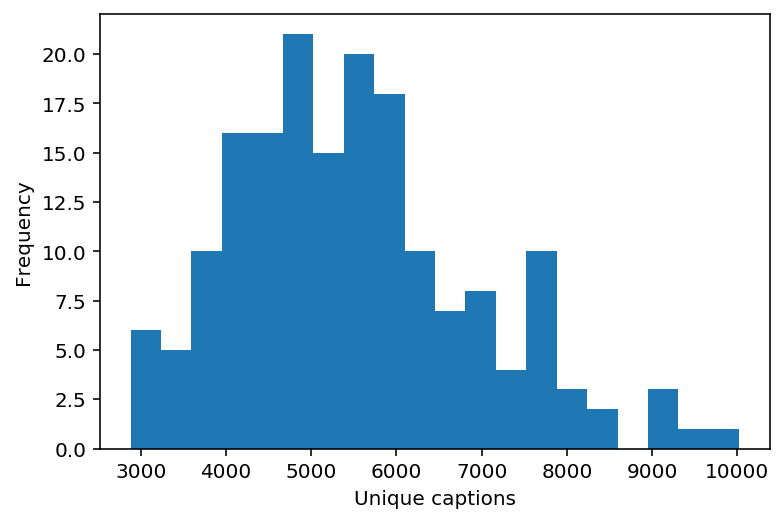
responses = df["n_unique"]
ax = responses.plot.hist(bins=20)
ax.set_xlabel("Unique captions")
[14]:
Text(0.5, 0, 'Unique captions')
[15]:
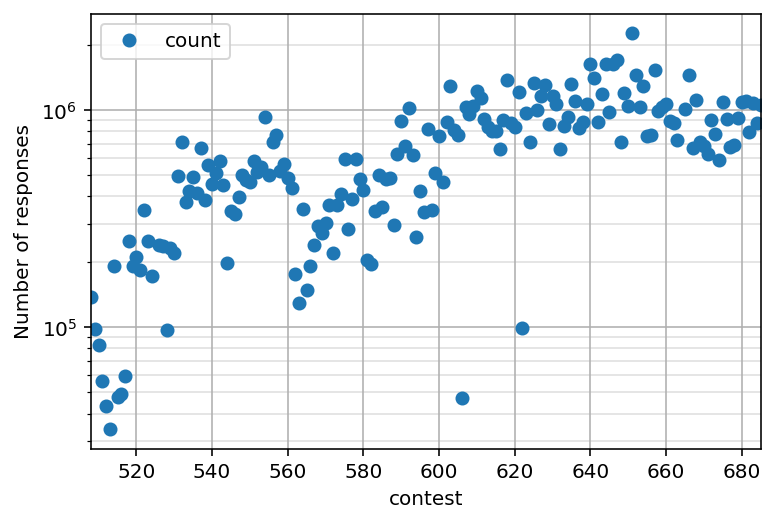
ax = df.reset_index().plot(x="contest", y="count", style="o")
ax.set_yscale("log")
ax.grid()
ax.grid(which="minor", alpha=0.4)
ax.set_ylabel("Number of responses")
[15]:
Text(0, 0.5, 'Number of responses')
[16]:
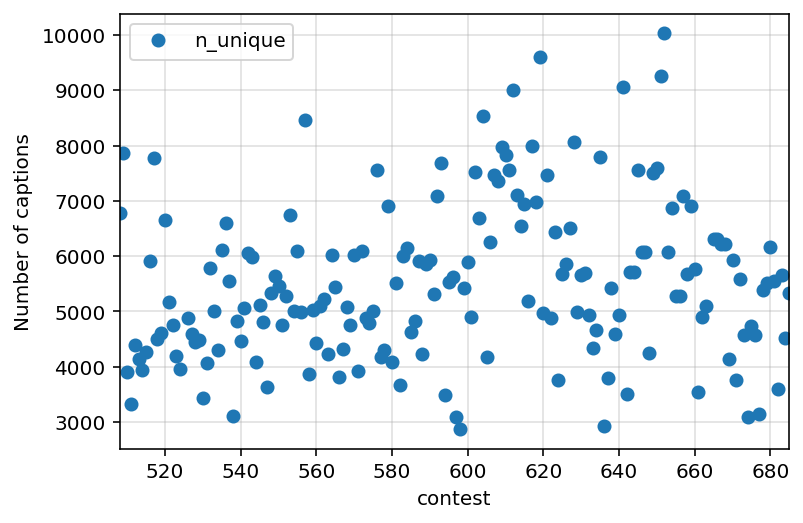
ax = df.reset_index().plot(x="contest", y="n_unique", style="o")
ax.set_ylabel("Number of captions")
ax.grid(alpha=0.4)
[ ]: